
Two Harbors Investment Corp. is proud to present: Primer on Agency Prepayments, part one of a two part webinar series on prepayments. The company believes periodic webinars will provide an opportunity to share more in-depth insights on various topics which may help investors, analysts and the media develop a deeper understanding of the residential mortgage and housing markets and the company. PRIMER ON AGENCY PREPAYMENTS Part One: Prepayments Webinar Series Transcript Two Harbors Investment Corp. September 12, 2012 Split Rock Lighthouse Two Harbors, MN
September 12, 2012 PRIMER ON AGENCY PREPAYMENTS 1 CORPORATE PARTICIPANTS July Hugen Director of Investor Relations Bill Roth Co-Chief Investment Officer TWO HARBORS’ WEBINAR: PART ONE- PRIMER ON AGENCY PREPAYMENTS July Hugen: We are pleased you could join us today for the next webinar in our series. Through this series we intend to share more in-depth insights on various topics and help investors develop a deeper understanding of the mortgage and housing markets and our company. I’m July Hugen, Director of Investor Relations for Two Harbors, and with me today is Bill Roth, Two Harbors’ Co-Chief Investment Officer. The presentation to this webinar is also available via download by clicking the “Event Resources” tab in the lower left corner of your screen. Click “Presentation Slides” or right click and save, to download the PDF of the slides. Please note that this webinar is pre-recorded. We encourage you to contact Investor Relations if you have additional questions or would like to discuss this topic further. Contact information for Investor Relations can be found on Slide 21. SAFE HARBOR STATEMENT Before we begin today, I would like to take a moment to remind you that remarks made by Two Harbors' management during this webinar and the supporting slide presentation may include forward- looking statements. Forward-looking statements reflect our views regarding future events and are typically associated with the use of words such as anticipate, target, expect, estimate, believe, assume, project, and should, or other similar words. We caution investors not to rely unduly on forward-looking statements. They imply risks and uncertainties, and actual results may differ materially from expectations. We urge you to carefully consider the risks described in our filings with the SEC, which may be obtained on the SEC's website at www.sec.gov. We do not undertake any obligation to update or correct any forward-looking statements if later events prove them to be inaccurate. TWO HARBORS’ COMPANY OVERVIEW By way of introduction, Two Harbors is a hybrid mortgage REIT that invests in the residential mortgage and housing sectors. Our common stock is traded on the New York Stock Exchange under the ticker, “TWO”, and we have a market capitalization in excess of $3 billion. We utilize a relative value investment approach across the residential mortgage and housing universe to identify the most attractive investment opportunities. This approach enables us to shift our asset allocation with changing market conditions in effort to maximize stockholder returns. Our mission is to be recognized as the industry leading mortgage REIT. We’ll accomplish this by achieving excellence in four areas:
September 12, 2012 PRIMER ON AGENCY PREPAYMENTS 2 • First, through fluid capital allocation and superior portfolio construction, including rigorous security selection and credit analysis; • Second, through unparalleled risk management with a strong focus on hedging and book value stability to our portfolio; • Third, through targeted diversification of the business model; • And finally, through leading governance and disclosure practices. Our mission guides us as we strive to deliver value to our stockholders. We manage a portfolio that as of June 30th is approximately $11 billion. And, we are proud that our portfolio performance has enabled us to deliver a total stockholder return of 78% since we commenced operations in late 2009. You may recall that for the launch of our webinar series we focused on Sub-Prime bonds. Today, we would like to transition to the Agency sector and concentrate on prepayments. We have formatted this presentation to be viewed as the first of a two-part series. Today, Bill will present an overview on Agency prepayments and provide insights into how we think about borrower prepayment behavior in the context of constructing our Agency portfolio. In a subsequent webinar, Bill will lead us through an advanced discussion by incorporating a quantitative approach to analyzing prepayments. I would now like to turn the webinar over to Bill. MORTGAGE AMORTIZATION Bill Roth: Thank you for joining us today. I would like to begin today’s discussion by summarizing the amortization feature of a mortgage loan and how it relates to borrower prepayments. A mortgage is a loan in which real estate property is secured as collateral against which the owner can borrow money. The majority of mortgages today are structured as amortizing loans, meaning the pay down of principal is attained over time through regularly scheduled payments. The amortization schedule determines how much of each monthly payment is interest and how much is payback of principal. The best way to solidify this concept is to walk through an example. Let’s say you borrowed $100,000 for a 30-year, 4.0% fixed rate mortgage. You would be contracting to make 360 monthly payments of approximately $477. The slide illustrates that the total payments for the first year will consist of $3,968 in interest and $1,761 in principal. Further, as your balance declines each month, the amount of your payment that is interest goes down and the amount that is principal goes up. Compare the first year amounts to those of the twenty-eighth year. The portion of the payment that is directed towards the principal balance has increased significantly. For the twenty-eighth year, only $553 of the year’s total payment will be applied as interest while the remainder will be directed to principal. Most mortgage agreements provide the borrower the option to make payments that are in excess of the scheduled monthly payment. This excess over the principal owed is what the industry refers to as a prepayment. This includes paying down the loan in its entirety in one lump sum or making a partial prepayment in any given month. A partial prepayment by the borrower affectively accelerates the amortization schedule and retires the mortgage prior to the original scheduled retirement date, while a total payoff terminates the mortgage immediately.
September 12, 2012 PRIMER ON AGENCY PREPAYMENTS 3 Let’s return to our $100,000 mortgage example. Consider the following scenario. After five years you decide to purchase a larger house, and as a result of this decision, you sell your existing home to pay off the mortgage. After you make your sixtieth mortgage payment, you retire the mortgage by making a payment for the outstanding principal balance of $90,448. This action triggers a prepayment and retires the loan in approximately five years as opposed to the original loan term of thirty years. PREPAYMENT EXAMPLE At Two Harbors, we primarily invest in securitized pools which are comprised of many individual mortgage loans. When we refer to the term “prepayment,” we are referring to the prepayment rate on a pool of mortgages as opposed to an individual mortgage. From the perspective of a mortgage pool, a prepayment is the aggregate of the underlying payments less the amortization of the pool. The incremental proceeds are applied towards reducing the pool’s principal balance. The Constant Prepayment Rate, or “CPR,” is the annual rate at which the outstanding principal balance of a mortgage pool is paid down after taking into account scheduled principal payments. Consider the following example: Let’s say we own a Fannie Mae 4% pool with a beginning balance of $100 million. Over the course of a year, the pool provides scheduled interest payments of $4.0 million and scheduled principal payments of $1.7 million for a total of $5.7 million. A CPR of 15% implies that 15% of the pool prepaid in one year after considering regular scheduled payments. This translates into additional principal payments of $14.7 million for the year, which reduces the ending balance to $83.6 million. IMPACT OF PREPAYMENTS ON CASH FLOWS Understanding prepayments and what drives them is important in that prepayments impact your cash flows, and as a result, impact the average life and also the return you receive on your investment. I would like to build on the example from the previous slide to illustrate how different CPRs can impact a pool’s cash flows. If you recall, the Fannie Mae 4% pool had a beginning balance of $100 million and we assumed an expected CPR of 15%. In this example, we estimate total cash flows over the life of the bond to be $121.4 million with a weighted average life of 5.3 years. If the CPR decreased to 6%, then the total cash flows would increase to $140.2 million and the average life would increase to 10.1 years. In a scenario in which the CPR increased to 30%, the total cash flows would decrease to $110.8 million and the average life would decrease to 2.7 years. There is an inverse relationship between CPR and the average life of a mortgage pool. An increase in CPR decreases both the total cash flow over the life of the bond and the average life of the pool. On the other hand, a decrease in CPR will increase the total cash flows and extend the pool’s average life. PRIMARY SOURCES OF PREPAYMENTS There are a number of borrower actions that triggers a prepayment. For today’s webinar I would like to review the most prevalent sources, which include curtailments, delinquencies and defaults, housing turnover, and refinancing.
September 12, 2012 PRIMER ON AGENCY PREPAYMENTS 4 CURTAILMENTS A curtailment is a payment made by the borrower in an amount that is greater than the scheduled payment and less than the outstanding principal balance. The incremental amount over the scheduled payment reduces the outstanding balance and subsequently shortens the life of the loan. Let’s return to our $100,000, 4.0% mortgage to illustrate two examples of borrower actions that result in curtailment. Let’s imagine that you received a bonus from your employer prior to your sixtieth mortgage payment, and as a result you decide to make an additional one-time principal payment of $10,000. If you continue to make payments as originally scheduled, this one time prepayment of $10,000 will enable you to pay off the mortgage in approximately twenty-six years. This is because more of your future monthly payments go to paydown principal, thus reducing the time to pay off your loan. Another example of curtailment is if you decide to round up your monthly mortgage payment. Instead of the $477 required monthly payment, let’s say that you decide to make a consistent monthly payment of $500. This decision to pay a little extra each month enables you pay off the mortgage in approximately twenty-eight years and save approximately $7,000 in interest payments over the intended life of the loan. DELINQUENCIES AND DEFAULTS When a mortgage in a government-backed pool reaches a stage of serious delinquency, it is effectively in default and typically the loan will be bought out of the pool and the lender will receive par for it. From the perspective of an RMBS investor, this buyout is considered a prepayment and is referred to as an “involuntary prepayment.” Delinquencies, and ultimately defaults, historically have not been a primary source of prepayments. Agency mortgages are underwritten with the highest credit standards, and as a result, delinquency driven prepayments have been relatively low and stable. The notable exception to this trend is the surge in delinquencies experienced during the recent housing crisis. The graph on this slide captures Freddie Mac delinquency data since the beginning of 2004. Delinquencies were fairly stable through 2007 at less than 1%. However, Agency pools started experiencing a rapid acceleration in delinquencies after that. This was due to more lenient underwriting standards, an increase in unemployment and a decline in housing values. Nonetheless, delinquencies continued to be a small factor in Agency prepays. The graph shows that even at its peak, Freddie Mac delinquencies remained fairly low at approximately 4%. DETERMINANTS OF HOUSING TURNOVER Housing turnover normally results from home sales by individuals who are looking to move to another residence. Since the borrower in most instances is required to pay the lender the outstanding mortgage balance upon sale, housing turnover typically triggers a prepayment. From an historical perspective, we have observed prepayments attributed to housing turnover to be fairly stable. We estimate that housing turnover contributes on average about four to six percent in CPR for generic Agency pools.
September 12, 2012 PRIMER ON AGENCY PREPAYMENTS 5 There are a number of determinants that influence housing turnover. Life events are the common reasons homeowners attribute to the sale of their home. In addition, there is also the homeowner’s general desire to upgrade to a better home. Economic conditions are additional variables to consider. A favorable labor market, home price appreciation and solid housing inventory typically result in increases in turnover. In addition, individuals often times take advantage of appreciation in home equity to use towards the purchase of another home. Seasonality is another factor. Home sales usually follow the school year calendar. Peaks in housing turnover typically occur between the months of May through August while winter months have historically been slow. REFINANCING OVERVIEW A homeowner may choose to refinance a mortgage for a number of different reasons, including obtaining a lower mortgage rate, changing the terms of the mortgage – such as transitioning from an adjustable rate to a fixed rate mortgage, and taking cash out to access the equity in the home. Another source of refinancing is credit curing. This is when a borrower who previously obtained a high mortgage rate due to a history of bad credit chooses to refinance because he is now eligible for a more favorable rate. RELATIONSHIP BETWEEN MORTGAGE RATES AND CPR Typically, the major determinant of prepayments are those driven by refinancing, as borrowers look to lock in a lower interest rate. Refinancing incentive is a very strong driver of prepayments. However, there are nuances and exceptions to relationship, which we will review later. Let’s take a look at historical prepayment rates compared to changes in mortgage rates. This chart shows the Freddie Mac 30-year mortgage commitment rates, starting in the year 2000, against the prepayment speeds experienced by the Freddie Mac portfolio, lagged by six months to capture the time it takes to respond to changes in rates and close on a new mortgage. You can see that the market experienced notable increases in prepayment activity during periods of falling mortgage rates, in 2003 and 2009. Note how the second wave of refinancing in 2009 was less dramatic than the activity in 2003. These observations reflect a trend referred to as refinancing “burnout.” We will discuss this concept later. One other note is that the bump in CPR in early 2010, identified on the chart by the red circle, was not due to borrower’s refinancing, but rather the buyout of severely delinquent loans by the GSEs. This was a one-time event and will likely not occur going forward. IMPACT OF RATE MOVEMENTS ON AGENCY SECURITIES Before we analyze the incentive a borrower might have to refinance, let’s take a look at why understanding prepayments is so important. We will continue with our example using the Fannie Mae 4% pool. A homeowner will typically look to refinance when mortgage interest rates decline and he can get a lower monthly payment. Refinancing triggers prepayments and the speed for the pool will subsequently increase. Let’s increase the CPR assumption to 30%, which is similar to what we reviewed in an earlier slide. This increase in CPR will shorten the average life of the pool to 2.7 years. The early return of principal exposes the RMBS investor to reinvestment risk in the lower rate environment. Instead of earning 4% for an average of 5.3 years, you only earn it for 2.7 years and the principal you get back early
September 12, 2012 PRIMER ON AGENCY PREPAYMENTS 6 will be invested at a rate lower than 4%. Furthermore, the pool will not increase in price by much, as it becomes such a short term investment. In a scenario when rates rise, the borrower is happy with the 4% rate and will not look to refinance. Refis are typically very low in a rising rate environment. The prepay rate of the pool will decrease, as demonstrated here by our 6% CPR assumption. The underlying cash flows will lengthen, which increases the average life of the pool to 10.1 years. This delay in the return of principal has two disadvantages to the investor. First, you are earning only 4%, when the new rates in the market are higher. Secondly, the asset is much longer than expected and as such, the value of the pool will go down in price more, due to being a longer term security, in this case, 10 years. This effect is called extension risk. It is important to note how the borrower benefits in both a rising and declining rate environment. As the RMBS investor, we are exposed to risks in both scenarios, but are generally compensated for this exposure to prepayment risk by receiving a spread over the Treasury yield curve. You can see that the investor has given an option to the borrower to either prepay his mortgage sooner, or keep it longer, depending on which is to his advantage. The value of this option can be determined and implicitly deducted from the spread over Treasuries we receive. This net spread is referred to as the option adjusted spread, and it takes into account the embedded option of the security. Furthermore, the fact that our investment will only increase slightly in value in a rally, but will decrease meaningfully in a sell- off, is also very important. We will be covering this concept, as well as the concept of option-adjusted spread, in the advanced webinar on prepayments. REFINANCING INCENTIVE AND POOL SEASONING The primary determinant of borrower refinancing behavior is the refinancing incentive. The refinancing incentive is the difference between the borrower’s current rate and the prevailing mortgage rate. In short, it is how much can the borrower save by refinancing. The table on the left shows a borrower with a 5% rate on a $200,000 mortgage. If rates drop to 4.5% and it took no effort or cost to refinance, surely he would do so. But, refinancing is a several month process and the national average cost of refinancing is $3,724. So, a bit of math is in order to see how incentivized the borrower is to go through the hassle to refi. You can see that in this scenario, while the borrower will save $61 per month, it will take approximately 5.1 years to recoup the refinancing costs before he will benefit from refinancing. If rates drop to 3.5%, as shown in the chart on the bottom, the time to breakeven is only 1.8 years, and therefore the incentive is much greater. The graph on the right shows the refinancing incentive curve for a 30-year fixed rate mortgage pool. There is an inverse relationship between movement in interest rates and the refinancing incentive. As rates go up there is negative incentive, thus expected prepay speeds are low. The right side of the graph shows a positive incentive to refi and you can see in the graph that the expected prepay speed increases. The borrower’s increased propensity to refinance given a higher refinancing incentive is captured by the steep curve. However, there comes a point where the refinancing incentive, while greater, causes prepays to increases marginally and eventually flatten out. This is the top right part of the curve. This is reflective of what the industry refers to as the “burnout” effect that I mentioned earlier. Borrowers who are efficient in exercising their option to refinance have left the pool, thus leaving behind the less effective
September 12, 2012 PRIMER ON AGENCY PREPAYMENTS 7 exercisers. The pool over time becomes seasoned and only borrowers who remain in the pool are those who have chosen not to refinance even in the light of a high refinancing incentive. This behavior is captured by the flattening that occurs towards the end of the curve. The function of this curve emulates the shape of an “S,” and is often times referred to as a “Refinancing S-Curve.” ROLE OF LOAN BALANCES As we saw, the monthly savings is not the only determinant of a borrower’s motivation to refinance. There is the cost to refinancing. This cost can be a deterrent to borrowers with a low loan balance and is substantially less of an issue for borrowers with a higher loan balance. Slide 16 illustrates how the outstanding loan balance is a factor in a homeowner’s motivation to refinance. The middle column duplicates the scenarios from the previous slide for a borrower with a $200,000 loan. The right column shows a borrower with a $500,000 loan. Given the same 50 basis point decline in rates, this borrower saves $151 a month, thus recouping his refi costs in only 3.7 years. This is a sharp contrast to the borrower on the left who only has a $50,000 loan, as it will take him approximately 12.5 years to recoup his refinancing cost. Compare this to a meaningful decline in the mortgage rate of 150 basis points. The $200,000 mortgage holder can break even in 1.8 years. This compares to 1.3 years for the $500,000 borrower and 4.4 years for the $50,000 borrower. Clearly, the large loan balance borrower has more incentive for a small movement in rates and the low loan balance borrower is unlikely to refinance without a significant decline in rates. AGENCY SEASONED BOND EXAMPLE Let’s now look at how a seasoned mortgage pool can exhibit low and stable prepayments due to the “burnout effect” I mentioned earlier. Fannie Mae pool #254449 is a bond that is representative of those we seek to own in the sector. The borrowers’ average rate is 7.5% and the pool carries a 7% coupon. Almost all the mortgages in this pool were originated in 2002, meaning that these loans have been seasoned for about ten years. The pool’s original balance was approximately $236 million, but the current pool factor is about 4%, meaning that approximately 96% of the original mortgage balance has been paid down. This leaves only about $10mm left. The weighted average maturity is 229 months or approximately 19 years. The graph on the right illustrates how the 12-month prepayment speeds for this bond accelerated through the refinancing boom of 2003 and subsequently has experienced a steady decline from 2004 to the beginning of 2009. Note how the 12-month prepayment rate for this pool declined substantially from 39.5% to 8.6%. The borrowers who are left in the pool apparently have not taken advantage of the many refi opportunities they’ve had over the past ten years and, thus, it could be reasonably assumed that they are unlikely to do so in the future. The table at the bottom shows our view of the benefits of a season pool versus a generic pool. A seasoned pool has a narrower prepayment range and a correlated range of average lives. Conversely, a generic pool has a broader prepayment range of average lives. Note how the weighted average life for the seasoned Fannie Mae 7% pool compares to the generic Fannie Mae 4% pool we reviewed earlier.
September 12, 2012 PRIMER ON AGENCY PREPAYMENTS 8 The range of average lives for the seasoned Fannie Mae 7% pool is more stable at 2 years versus almost 8 years for the generic 4% pool. LOAN ORIGINATION CHARACTERISTICS Studying loan characteristics is also valuable in modeling prepayment behavior. We look at many different factors, including product type, origination year and month, credit quality, mortgage servicer and geography. Let’s quickly review a few examples to provide you some insight into how prepayment speeds may vary by these characteristics. In regards to product type, 15-year mortgages are common refi products, especially for higher quality borrowers who can make the higher monthly payment. These borrowers are typically financially strong and have an attractive credit profile, as demonstrated by high FICO scores and low LTV ratios. Borrowers who select 15-year mortgages, thus, are commonly highly effective exercisers of the refinancing option. Credit constrained, lower FICO borrowers usually do not have as many opportunities to refinance their mortgages, especially in today’s credit environment. Credit was readily available in 2005 through a variety of channels, however, with today’s more rigorous lending standards, the credit constrained borrower is limited in his options to refinance into a lower mortgage rate. Geography is an interesting factor in analyzing borrower refinancing behavior. The table on the right shows the ratio of Fannie Mae 30-year 4% prepayment speeds of selected states in relation to the cohort. Some states experience consistently higher prepayment speeds than other states, as indicated by a ratio greater than one. For example, California has a three-year average ratio of 1.48. This can be attributed to high loan balance mortgages and higher turnover rates in the state. Illinois is more typical, albeit slightly faster due to some parts of the state having high loan balance mortgages. On the other hand, Puerto Rico is very slow with an average three year ratio of 0.24. TWO HARBORS’ AGENCY STRATEGY AND PORTFOLIO Based on today’s discussion, you can see how owning Agency securities that experience stable prepayment speeds is extremely valuable to the RMBS investor. At Two Harbors, we have constructed our Agency portfolio by applying an intense focus on selecting prepayment protected securities. We believe this approach provides for more stable cash flows and sustainable yields. In addition, the stability of these cash flows enables us to more effectively hedge the interest rate exposure of these assets. Let’s take a look at our Agency portfolio in detail. As we have discussed, borrowers with low loan balances do not typically have as much financial incentive to refinance in comparison to borrowers with higher loan balances. As of June 30, $85,000 Maximum Loan Balance pools and Other Low Loan Balance Pools comprised approximately 42% of our Agency portfolio. Borrowers with high LTV ratios or low FICOs scores are most likely limited in their opportunities to refinance due to less desirable loan and borrower characteristics. However, there are exceptions, including those borrowers who have taken advantage of government refinancing programs, such as HARP. Here we define High LTV Pools as pools collateralized by loans with greater than or equal to 80%
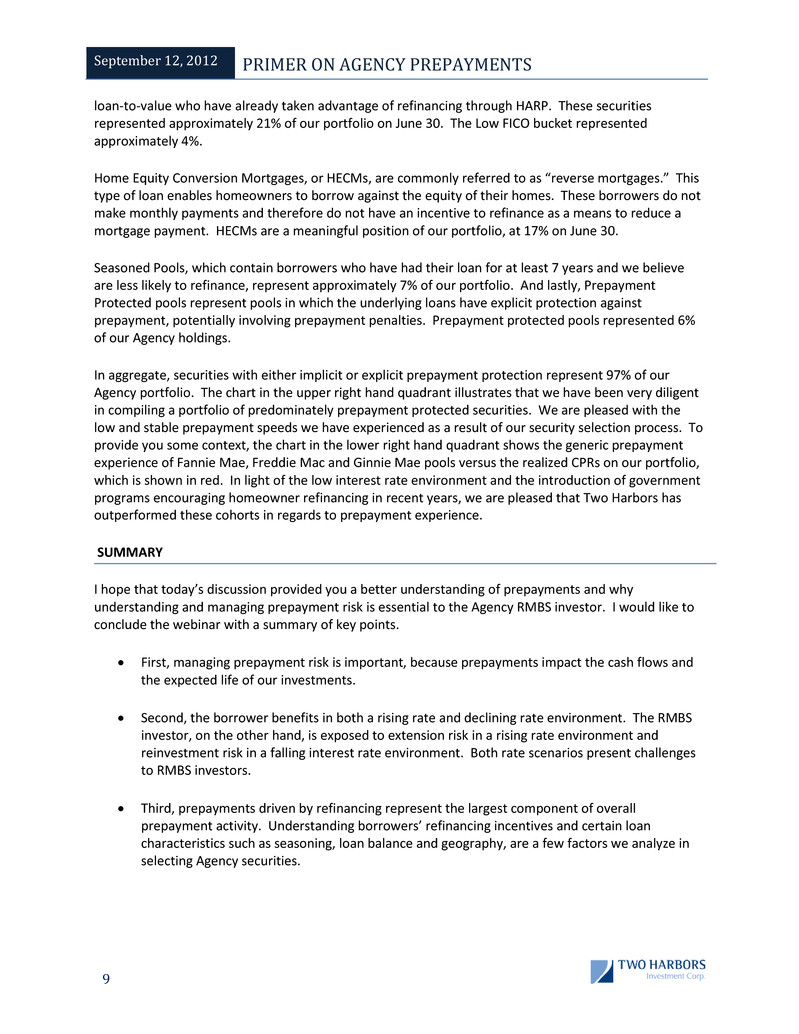
September 12, 2012 PRIMER ON AGENCY PREPAYMENTS 9 loan-to-value who have already taken advantage of refinancing through HARP. These securities represented approximately 21% of our portfolio on June 30. The Low FICO bucket represented approximately 4%. Home Equity Conversion Mortgages, or HECMs, are commonly referred to as “reverse mortgages.” This type of loan enables homeowners to borrow against the equity of their homes. These borrowers do not make monthly payments and therefore do not have an incentive to refinance as a means to reduce a mortgage payment. HECMs are a meaningful position of our portfolio, at 17% on June 30. Seasoned Pools, which contain borrowers who have had their loan for at least 7 years and we believe are less likely to refinance, represent approximately 7% of our portfolio. And lastly, Prepayment Protected pools represent pools in which the underlying loans have explicit protection against prepayment, potentially involving prepayment penalties. Prepayment protected pools represented 6% of our Agency holdings. In aggregate, securities with either implicit or explicit prepayment protection represent 97% of our Agency portfolio. The chart in the upper right hand quadrant illustrates that we have been very diligent in compiling a portfolio of predominately prepayment protected securities. We are pleased with the low and stable prepayment speeds we have experienced as a result of our security selection process. To provide you some context, the chart in the lower right hand quadrant shows the generic prepayment experience of Fannie Mae, Freddie Mac and Ginnie Mae pools versus the realized CPRs on our portfolio, which is shown in red. In light of the low interest rate environment and the introduction of government programs encouraging homeowner refinancing in recent years, we are pleased that Two Harbors has outperformed these cohorts in regards to prepayment experience. SUMMARY I hope that today’s discussion provided you a better understanding of prepayments and why understanding and managing prepayment risk is essential to the Agency RMBS investor. I would like to conclude the webinar with a summary of key points. • First, managing prepayment risk is important, because prepayments impact the cash flows and the expected life of our investments. • Second, the borrower benefits in both a rising rate and declining rate environment. The RMBS investor, on the other hand, is exposed to extension risk in a rising rate environment and reinvestment risk in a falling interest rate environment. Both rate scenarios present challenges to RMBS investors. • Third, prepayments driven by refinancing represent the largest component of overall prepayment activity. Understanding borrowers’ refinancing incentives and certain loan characteristics such as seasoning, loan balance and geography, are a few factors we analyze in selecting Agency securities.

September 12, 2012 PRIMER ON AGENCY PREPAYMENTS 10 • And lastly, prepayment protected securities have enabled Two Harbors’ Agency RMBS portfolio to historically experience low and stable prepayment speeds. We believe that focusing on prepayment protected securities provide for more stable cash flows and sustainable yields. I would now like to turn the webinar over to July for her closing remarks. CONTACT INFORMATION July Hugen: Thank you for your participation in today’s webinar. We hope that it has provided you a fundamental understanding of prepayments and how we approach our Agency portfolio in the context of managing prepayment speeds. We have been pleased with the performance of our Agency portfolio in respect to realized yields and prepayment speeds, and we will continue to look for investment opportunities that fit within our Agency strategy of selecting prepayment protected securities. We invite you to look for the second of our two part series on prepayments, which will approach this topic utilizing a quantitative assessment. In the interim, please do not hesitate to reach out to us if you have any additional questions on the material covered today. The contact information for our Investor Relations department is available on this slide. Before we conclude today’s webinar, I would like to announce our upcoming Analyst & Investor Day to be held at the New York Stock Exchange on October 10th. We are pleased to present Ivy Zelman, Chief Executive Officer of Zelman & Associates, as our special guest speaker. We hope you can join us. July Hugen Investor Relations Two Harbors Investment Corp. 612.629.2514 July.Hugen@twoharborsinvestment.com Anh Huynh Investor Relations Two Harbors Investment Corp. 212.364.3221 Anh.Huynh@twoharborsinvestment.com